| Percentage of Vote | |||||
|---|---|---|---|---|---|
| Party | 2004 | 2008 | 2012 | 2016 | 2020 |
| Liberal/LNP | 47.1 | 60.1 | 61.9 | 53.5 | 47.7 |
| Labor | 40.6 | 29.0 | 25.2 | 32.0 | 30.9 |
| Greens | 10.1 | 8.4 | 10.7 | 10.4 | 15.4 |
| Others | 2.2 | 2.5 | 2.2 | 4.1 | 6.0 |
| Liberal/LNP | 52.5 | 66.1 | 68.5 | 59.5 | 56.3 |
| Labor | 47.5 | 33.8 | 31.5 | 40.5 | 43.7 |
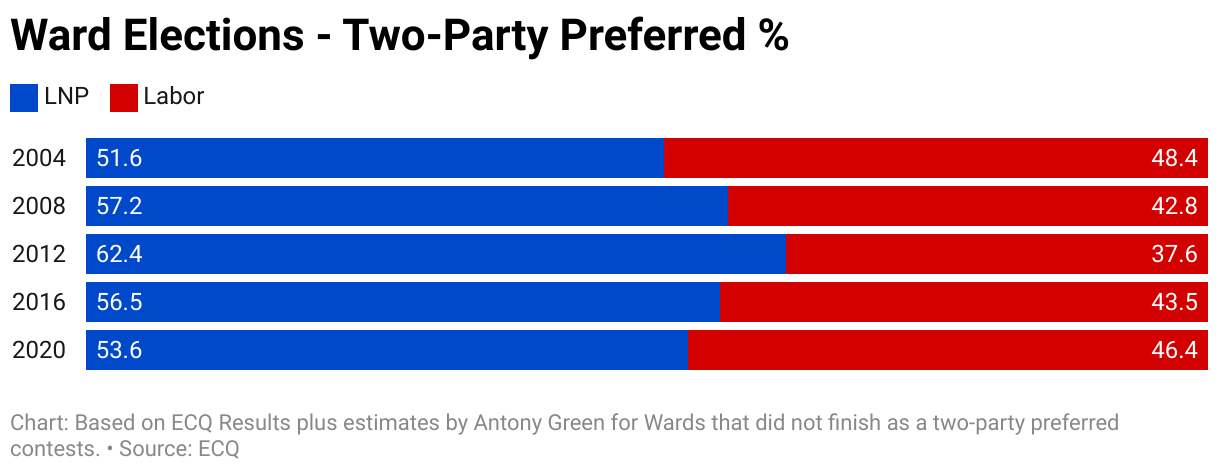
| Percentage of Vote | |||||
|---|---|---|---|---|---|
| Party | 2004 | 2008 | 2012 | 2016 | 2020 |
| Liberal/LNP | 47.0 | 52.5 | 57.1 | 49.9 | 45.9 |
| Labor | 42.8 | 37.2 | 32.0 | 32.2 | 32.9 |
| Greens | 8.1 | 9.8 | 8.5 | 14.5 | 17.8 |
| Others | 2.1 | 0.5 | 2.4 | 2.4 | 3.4 |
| Liberal/LNP | 51.6 | 57.2 | 62.4 | 56.5 | 53.6 |
| Labor | 48.4 | 42.8 | 37.6 | 43.5 | 46.4 |
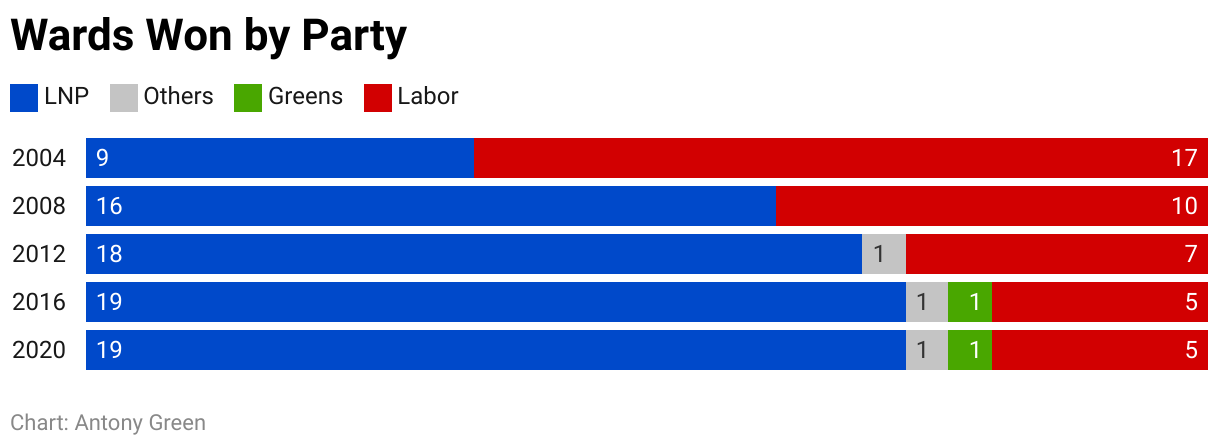
| Wards Won | |||||
|---|---|---|---|---|---|
| Party | 2004 | 2008 | 2012 | 2016 | 2020 |
| Liberal/LNP | 9 | 16 | 18 | 19 | 19 |
| Labor | 17 | 10 | 7 | 5 | 5 |
| Greens | .. | .. | .. | 1 | 1 |
| Others | .. | .. | 1 | 1 | 1 |
| Number of Candidates | ||||||
|---|---|---|---|---|---|---|
| Party | 2004 | 2008 | 2012 | 2016 | 2020 | 2024 |
| Labor Party | 26 | 26 | 26 | 26 | 26 | 26 |
| Liberal/LNP | 26 | 26 | 26 | 26 | 26 | 26 |
| The Greens | 17 | 23 | 18 | 26 | 25 | 26 |
| Others | 7 | 6 | 5 | 4 | 9 | 4 |
| Total | 76 | 81 | 75 | 82 | 86 | 82 |
| Average per Ward | 2.9 | 3.1 | 2.9 | 3.2 | 3.3 | 3.2 |